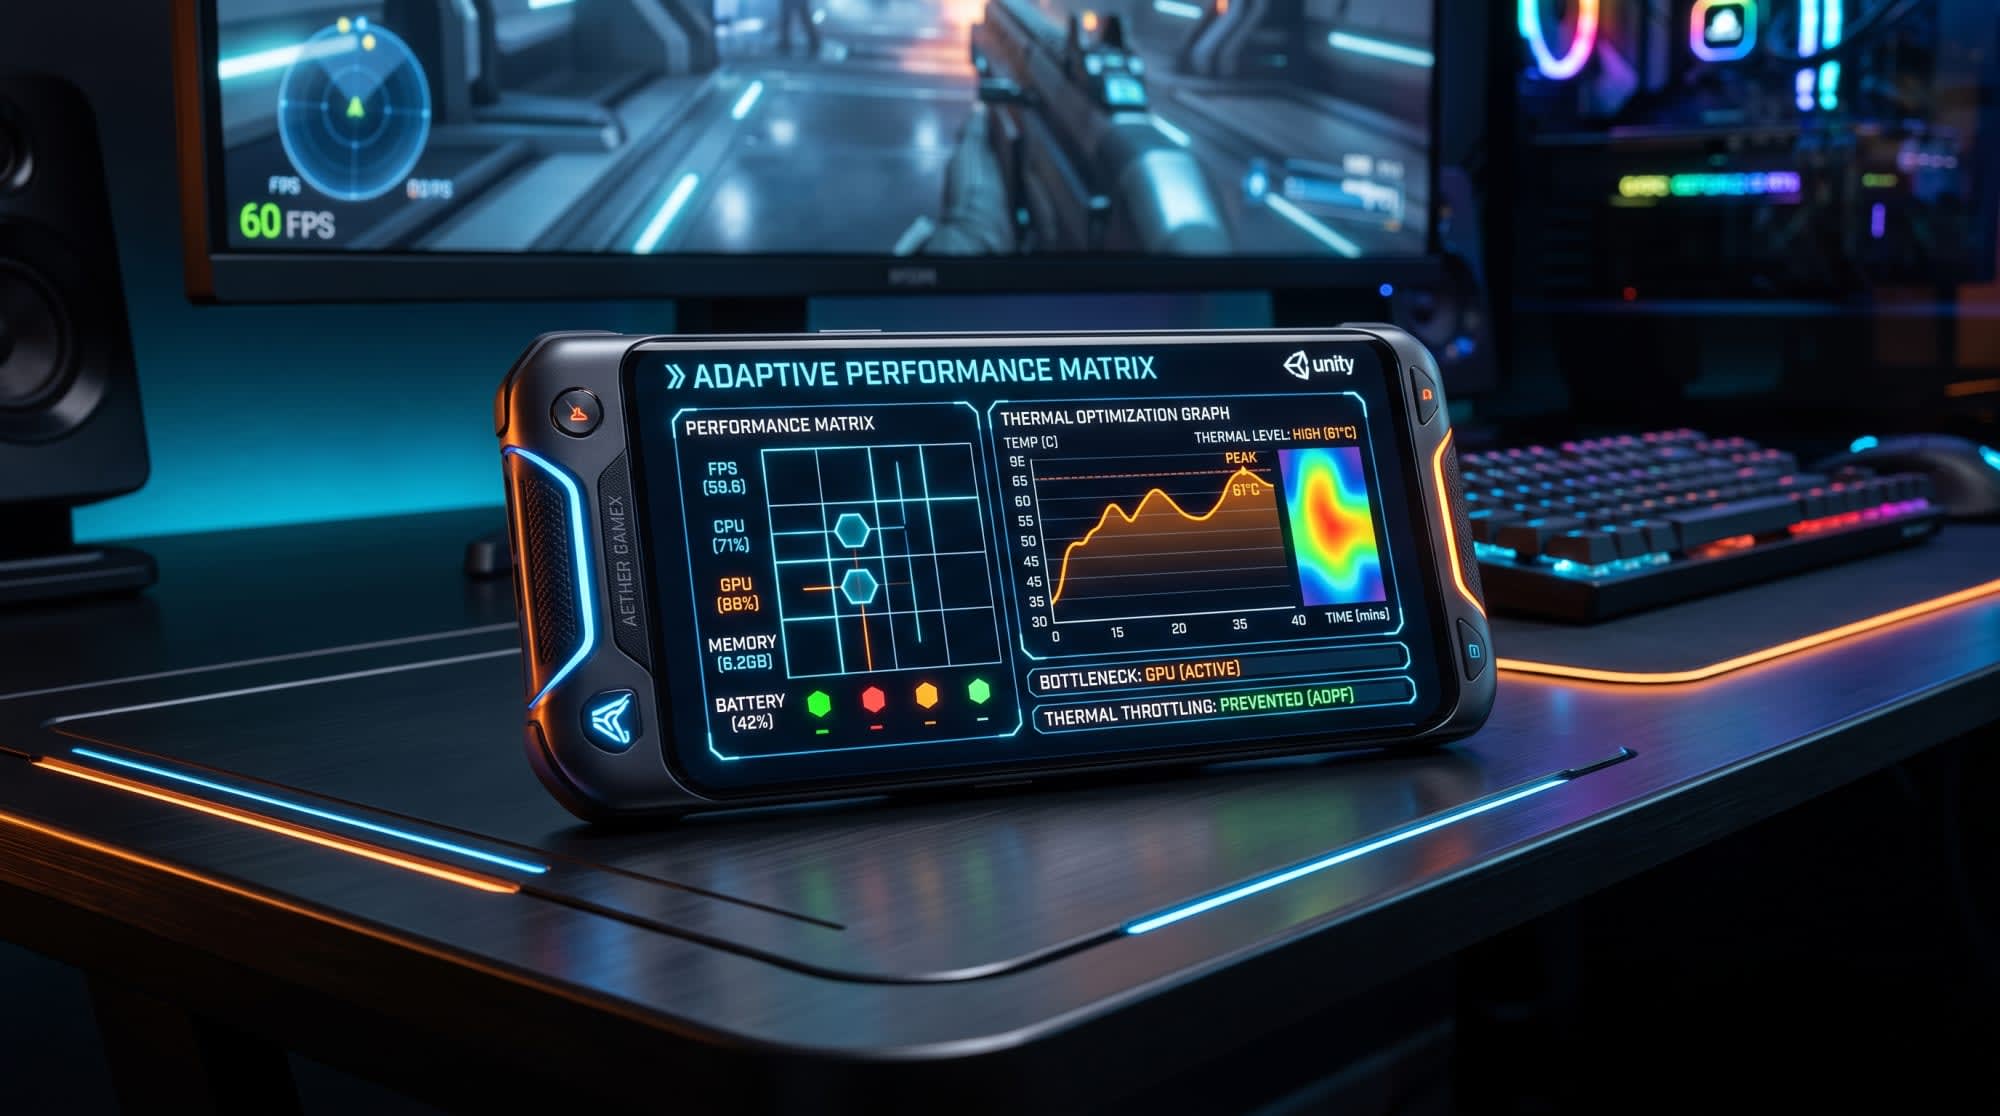
In-Depth Analysis of the Adaptive Performance System in Mobile Game Development on the Unity Engine
In the modern mobile game development ecosystem, the geometrical growth of hardware capabilities has paved the way for games that push graphical boundaries to run on portable devices. However, mobile platforms, unlike desktop or console systems, lack active cooling mechanisms (fans or liquid cooling systems). In a System-on-Chip (SoC) architecture, the central processing unit (CPU), graphics processing unit (GPU), memory controllers, and network modules coexist within a millimetric area.¹ Continuously running these components at high clock speeds inevitably leads to the generation of massive amounts of waste heat.
When the device's temperature reaches critical thresholds, the operating system activates a defense mechanism called "Thermal Throttling" to protect the hardware from physical damage and prevent the degradation of the battery's chemical structure.² This mechanism abruptly and aggressively lowers the CPU and GPU clock frequencies. For game developers, this means a sudden crash in frames per second (FPS), increased input lag, and a complete degradation of the player experience.³ At this exact point, the Unity Adaptive Performance system comes into play, aiming to bridge the gap between software and hardware so that the game engine can proactively adapt to the device's thermal dynamics. This report examines the fundamental architecture, scaling algorithms, integration strategies, and optimization advantages provided by the Adaptive Performance package with academic and professional depth, starting from the anatomy of configuration warnings frequently encountered during the development process.
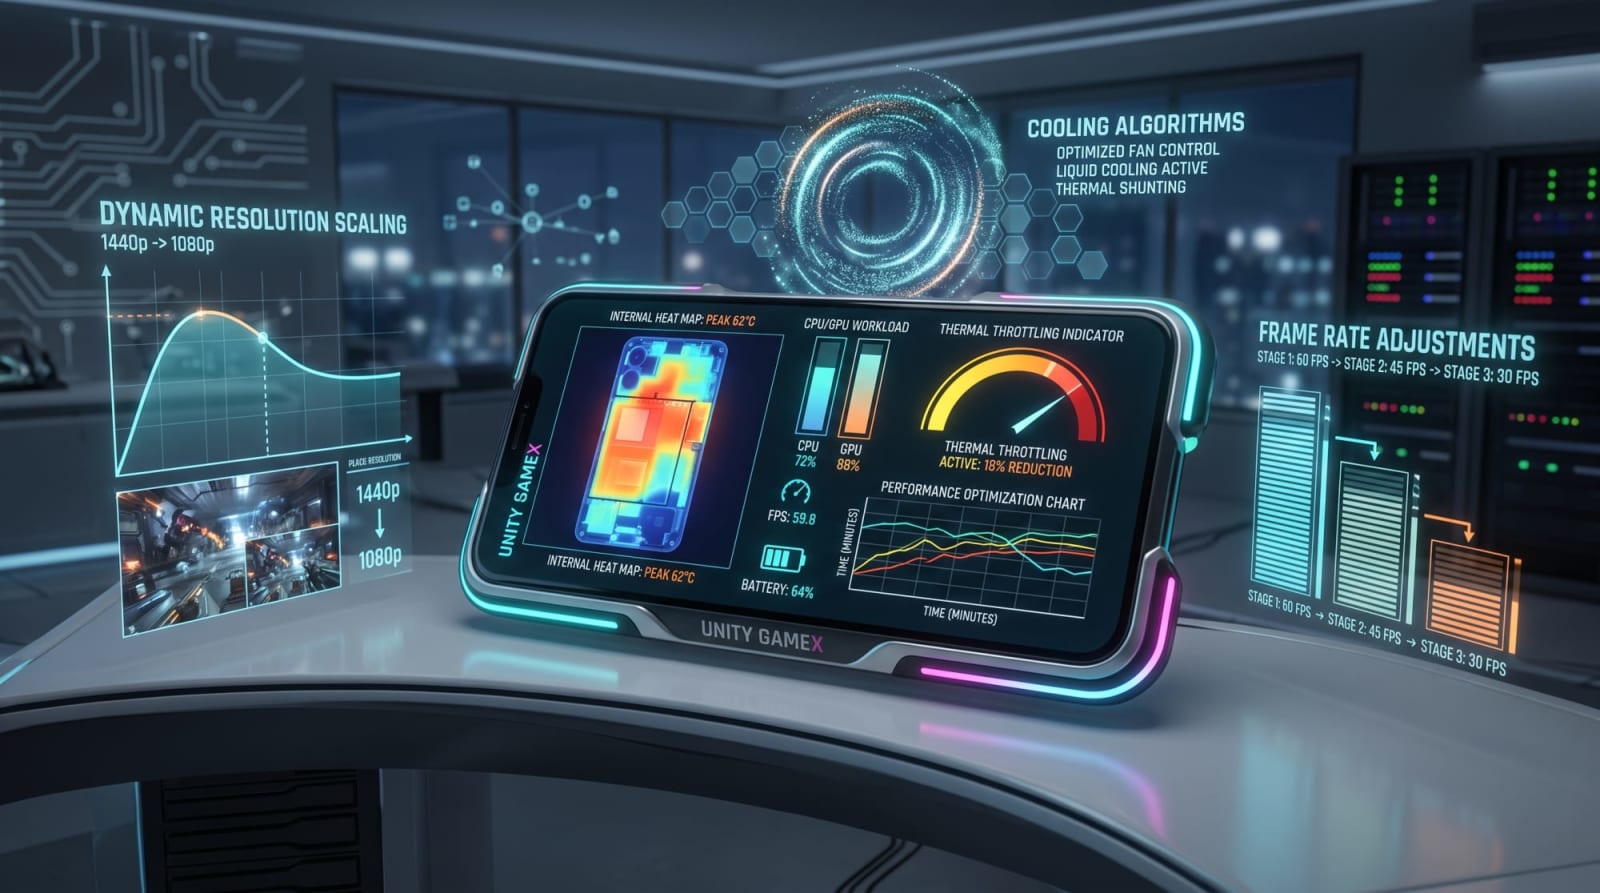
Root Causes of the "Adaptive Performance Settings" Warning and Configuration Solutions
When starting a new mobile project in the Unity game engine or configuring an existing project to be compiled for mobile platforms (Android, iOS), the following warning or a similar message frequently appears on the console screen: "No Adaptive Performance provider package installed. Adaptive Performance requires a provider to get information during runtime. Please install a provider such as Adaptive Performance Samsung (Android) from the Adaptive Performance Settings".⁴ The underlying reason for this warning, which halts the development processes of developers, is the working principle of Unity's modular package management system and Hardware Abstraction Layer.
Unity includes the Adaptive Performance base package as pre-installed in the project, especially when creating projects with templates like "Mobile 2D", "Mobile 3D", or "Universal Render Pipeline (URP)".⁵ However, the base package does not natively possess the native libraries capable of reading data from device hardware or intervening with the operating system. For the package to become functional, a "Provider" module specific to the targeted operating system (such as Android) or test environment must be added to the project and configured.⁶ When the provider module is missing, the base package cannot reach the hardware sensors at runtime and fires this warning to notify the developer. The solution and configuration steps for the warning show significant methodological differences depending on the target platform being developed for and the Unity version being used.
The solution to this warning encountered during the development process should be handled on a platform basis. Since the access permissions of operating systems to hardware APIs differ, the solutions offered by Unity also vary.
Target PlatformTechnical Cause of the WarningSolution Methodology to be AppliedAndroidThe native plugin to communicate with ADPF or Samsung GameSDK is not present in the project.The Adaptive Performance Android Provider or, if there is a device-specific target, the Samsung (Android) Provider package must be installed via the Unity Package Manager.⁶ Then, the relevant provider must be enabled from the Edit > Project Settings > Adaptive Performance menu.iOS (Apple)The absence of an official hardware provider supported by Unity for Adaptive Performance in the iOS ecosystem.⁴When the Mobile feature set is added to the project, Adaptive Performance comes as a dependency and cannot be deleted. For iOS builds, this warning is harmless and can be ignored, or the Mobile module can be removed from the package manager to break the dependency.⁴Desktop Editor (PC/Mac)The absence of mobile-specific thermal sensors and SoC architectures on Windows or macOS operating systems.To simulate mobile conditions on the development computer, the Simulator (Desktop) Provider must be installed and a virtual thermal environment must be created using the Device Simulator window.²Unity 6 (Build Profiles)Forgetting to configure profile-specific settings in addition to the main project's Adaptive Performance settings in the build profiles coming with Unity 6.In the File > Build Profiles menu, the Add Settings > Adaptive Performance Settings button must be clicked for the selected platform to assign the provider. Failing to add these settings in Unity 6.000.x versions leads to the "No default loader found" error.⁹
This warning is essentially not a compilation error, but a notification of a lack of optimization. The developer can ignore this warning and run the game on the device; however, in this case, the game will run completely blind to the hardware's thermal state and will inevitably be subjected to the operating system's ruthless thermal throttling interventions.
Architecture of the Adaptive Performance System and the Provider Ecosystem
Adaptive Performance builds a two-way communication bridge between the game engine's decision-making mechanisms and the physical hardware. The data collection layer of this architecture is formed by providers. Since the highly fragmented structure of the Android ecosystem makes it impossible for a single hardware API to work across all devices, Unity overcomes this problem with specific providers that integrate into different hardware frameworks.
Android Dynamic Performance Framework (ADPF) Integration
Unity's core "Android Provider" module is built upon the Android Dynamic Performance Framework (ADPF) architecture introduced by Google in the Android 12 operating system and later versions.² ADPF is a revolutionary API set that enables a direct dialogue to be established between games and the operating system's thermal management. In traditional approaches, the operating system tries to guess which frame of the game requires how much processor power, and these guesses usually result in the assignment of incorrect CPU clock speeds.
The Unity Adaptive Performance Android provider, on the other hand, provides a continuous data stream to the operating system via the "Performance Hint API".⁶ Every time a frame is rendered, the engine reports the target duration of that frame (for example, 16.6 milliseconds if 60 FPS is targeted) and the actual duration spent by the CPU and GPU to complete this frame to the ADPF system.⁶ Thanks to this sensitive feedback loop, the Android Android operating system raises the frequency of CPU cores only as much as the game needs. When the device starts to heat up, the operating system sends thermal warnings back to Unity, so that in-engine graphics scalers kick in before hardware-level throttling occurs.⁶ The stable versions of the Android Provider, version 1.2 and above (versions bypassing the Pixel device limitation), are supported after Adaptive Performance 5.0 and Unity 2021.3.⁶
Samsung GameSDK and Specific Hardware Optimizations
Because Samsung has one of the largest market shares in the Android ecosystem, it offers a customized hardware interface called GameSDK in order to push the limits of its own hardware. Unity's Adaptive Performance Samsung (Android) provider goes beyond standard ADPF features and allows metrics that delve directly into Samsung SoCs to be obtained.²
The Samsung provider covers a massive range of devices running Android 10 and above, supporting GameSDK 3.2 and more recent versions. This coverage extends from entry-level to flagship devices, offering developers a very wide optimization area.
Supported Samsung Galaxy SeriesModels (GameSDK 3.2+ / Android 10+)Galaxy S SeriesS9, S10e, S10, S10+, S10 Lite, S20, S20+, S20 Ultra, S20 Lite, S21, S21+, S21 Ultra, S22, S22+, S22 Ultra¹³Galaxy Note SeriesNote9, Note10, Note10+, Note10 Lite, Note20, Note20 Ultra¹³Galaxy Z (Foldable) SeriesZ Fold2¹³Galaxy A SeriesA10s, A11, A21s, A31, A41, A50s, A51, A51 5G, A71, A71 5G, A80, A8 2018, A9 2018, A90 5G¹³Galaxy Xcover SeriesXcover 4s, Xcover Pro¹³
One of the most important hardware advantages provided by these devices is the "Variable Refresh Rate" (VRR) technology.¹³ VRR support is actively used for now on Galaxy S20, S21, S22, and Note 20 devices.¹³ When Adaptive Performance detects that the device has reached its limits and decides to drop the game's FPS value from, say, 60 to 45, it sends a command to the Samsung VRR API to also lower the physical refresh rate of the screen to 45 Hz.¹⁶ This synchronization prevents screen tearing as well as prevents the display panel from consuming extra power, making a serious contribution to the device cooling down faster. Furthermore, the Samsung provider also offers access to "Cluster Info" data, which shows the load distributions of the big and little cores in the processor's big.LITTLE architecture on devices with GameSDK 3.5 (Android 12) and above.¹³
Thermal Metrics and Bottleneck Detection Algorithms
The engineering behind Adaptive Performance's ability to offer proactive optimization relies on sensor analysis systems that continuously collect data. The IAdaptivePerformance interface created at runtime of the game reads data sets from the hardware in two main categories: Thermal State Feedback and Frame Timing. In line with this data, it is decided what the main element (bottleneck) limiting the current performance of the system is.
Thermal Feedback and Warning Levels
The thermal state of the device is not evaluated solely through a simple Celsius degree reading. Thermal dynamics are monitored via three different metrics normalized and analytically processed ²:
The first metric, TemperatureLevel, is a floating-point value normalized between 0.0 and 1.0 (0.0 standard room/operating temperature, 1.0 absolute maximum thermal threshold).² Using this value, developers can present the heating status of the device to the player as a graphical bar in the game's interface or construct their own custom optimization logic.
The second and more predictive metric, TemperatureTrend, ranges between -1.0 and 1.0
and is a value representing the mathematical derivative of the temperature, in other words, the rate of change. 2 A value of 1.0 indicates that the device is heating up extremely rapidly, while a value of 0 indicates that the temperature remains stable, and -1.0 shows that an aggressive cooling period has been entered. The system's perceiving these trends and taking a valid average generally requires an analysis process of about ten seconds. 2 The third and most critical metric is a categorical classification called WarningLevel, which specifies the reaction the operating system will give to the thermal state. 2
WarningLevelOperating System StatusReaction of Adaptive Performance in the Game EngineNoWarning (0) The device is at optimal temperatures. There is no thermal throttling in question. The game is allowed to be rendered at the targeted highest resolution, frame rate, and visual quality. 2 ThrottlingImminent (1) Thermal capacity is about to fill up. The operating system has not yet lowered hardware frequencies, but danger is very close. Proactive intervention begins. By engaging scalers with low visual impact (such as shortening the shadow distance), an effort is made to prevent the device from passing to the next phase. 2 Throttling (2) The hardware has reached a critical temperature, and the operating system has aggressively lowered the CPU/GPU clock frequencies to protect itself. The bill for the most aggressive optimization is paid. The target frame rate (Target FPS) is dramatically dropped, the main render resolution is restricted, and radical trade-offs are made for the device to return to normal temperature. 2
Frame Timing and Bottleneck Detection
Failure of a game to reach a 60 frames per second rate can stem from multiple hardware inadequacies. Finding whether the issue stems from a graphics processing unit (GPU) insufficiency or the exhaustion of the central processing unit's (CPU) computing power is the first rule of optimization. To perform this analysis, Adaptive Performance tracks averageFrameTime and averageGpuFrameTime data on every frame. The 17 CPU time covers the processes where Unity's main thread runs game logic and the render thread prepares data to send to the GPU (draw call batching, etc.). 17 As an important detail, operating system-level blockages or idle/wait times where the CPU waits for the GPU to finish its work are not included in the CPU time measurement. 17 As a result of the analysis of these times, the system assigns the current bottleneck (PerformanceBottleneck) to one of four categories: ● CPU: In-game artificial intelligence algorithms, complex physics calculations, or excessive object instantiations are choking the processor. 20
● GPU: Multi-layered transparency effects (overdraw), reading high-resolution textures, heavy post-processing effects (such as SSAO or Bloom) are limiting the graphics unit. 22
● TargetFrameRate (Fillrate): The system has already reached the target frame rate, there is no hardware choking, and it suffices even if the hardware operates below its potential. 2
● Unknown: Intermediate states where the source of the delay cannot be determined with certainty.
Developers can subscribe to the PerformanceStatus.PerformanceBottleneckChangeEvent event (via the delegate pattern) to catch moments when the bottleneck state changes during gameplay and take appropriate algorithmic responses. 23 For example, when the bottleneck suddenly shifts to the CPU, the raycast scanning frequency of artificial intelligence units in the open world can be reduced from 60 times per second to 15 times, instantly easing the mathematical load on the processor.
Decision-Making and Execution Engine: Indexer and Scalers
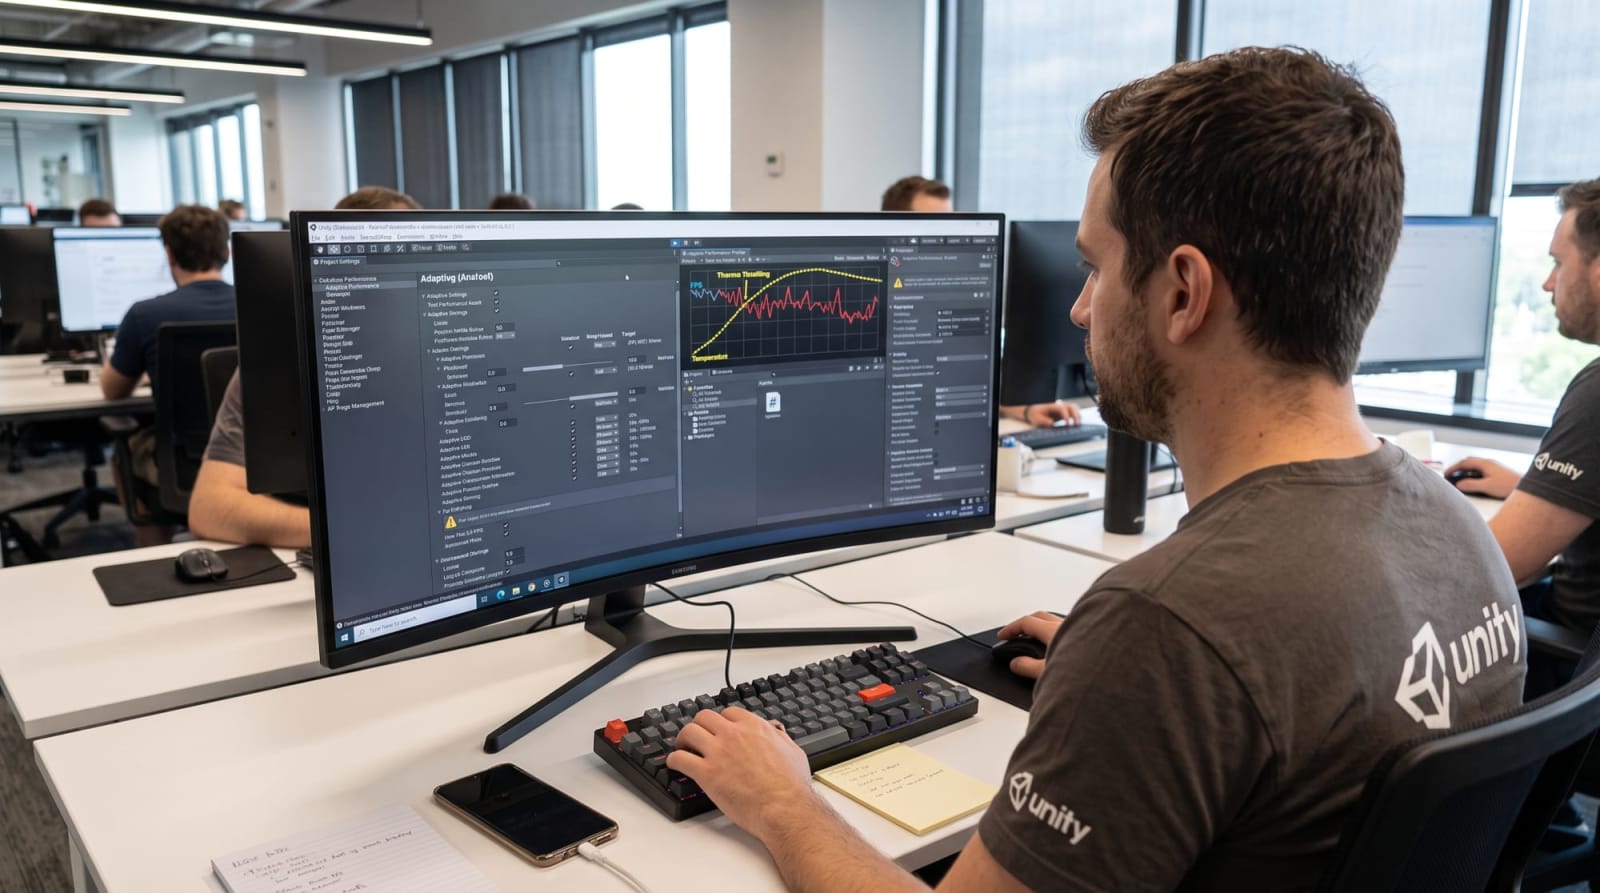
The mechanism that enables the Adaptive Performance system to operate autonomously relies on the flawless harmony of two core components: the brain named "Indexer" and the execution organs named "Scalers".
Indexer Mechanism
The Indexer is the central coordinator that calculates the game's current "Quality Index" by continuously passing complex thermal trends and bottleneck data received from the device through a mathematical filter. 19 The main task of the Indexer is to prevent visual inconsistency (oscillation) by constantly changing game quality with every minor heat or FPS fluctuation in the hardware. To ensure this stability, Thermal Action Delay and Performance Action Delay can be defined in seconds from Project Settings. 23 Even if the system senses a bottleneck, it makes sure the situation is persistent during this defined delay period, then makes an action decision and sends a signal to the attached scalers to decrease quality (StateAction.Decrease). 23
Mathematical and Visual Impact Analysis of Scalers
Scalers are scripts that modify specific features of Unity's Render Pipeline or physics engine at runtime. 19 The default level of each scaler is zero. This level increases with every "decrease quality" signal coming from the Indexer; as the level increases, the detail of the feature controlled by the scaler decreases. 19 When and in what order scalers will be activated is determined by a three-dimensional decision matrix 19 :
1. Targeting Bottleneck: If analysis reveals that the bottleneck is the GPU, the Indexer bypasses scalers optimizing the CPU and directly forces scalers targeting the GPU (for example, resolution).
2. Lowest Level: Priority is given to features whose levels have not been increased yet (preserving their original quality).
3. Visual Impact: The probability of the player noticing when the quality of the feature is reduced. Classified as Low, Medium, or High. 19 The system always starts by cutting features with Low visual impact first.
The system offers an extremely wide range of scalers for both the standard render pipeline and the Universal Render Pipeline (URP). The table below details the hardware targets of these scalers and their theoretical effects within the application.
Scaler Class Bottleneck Target Visual Impact Theoretical and Practical Effect in Render Pipeline AdaptiveFramerate CPU / GPU / Fillrate High Modifies the application's Application.targetFrameRate variable within limits. Particularly effective when VSync is off. A drop from 60 FPS to 30 FPS creates a radical cooling period by increasing the idle time of all components on the chip. 19 AdaptiveResolution GPU / Fillrate High Dynamically lowers the scale of the screen rendering resolution (Resolution Scale). 19
In URP projects, it operates via Render Scale. Since it geometrically decreases the pixel fillrate, it is the most powerful weapon in breaking GPU thermal load, but it directly disrupts image clarity. 15 AdaptiveLOD CPU / GPU Medium Manipulates the Level of Detail (LOD) transition distances (LOD bias) of 3D models in the scene. 18 It reduces CPU draw calls and GPU vertex calculations by ensuring low-poly versions stay on screen even when the camera approaches models. 18 AdaptiveShadowmapResolution GPU Medium/Low Lowers the pixel resolution of the shadow map in URP. Since pixelation of shadow edges when there is too much movement on screen is difficult to perceive cognitively, it relieves GPU memory bandwidth without sacrificing quality. 19 AdaptiveShadowCascade CPU / GPU Medium Reduces the number of cascades in URP directional lights. Each shadow cascade requires shadow-casting objects in the scene to be rendered once more (draw call). A decrease in the number of cascades directly alleviates CPU bottlenecks. 19 AdaptiveViewDistance CPU / GPU High Narrows the far clip plane of the main camera, ensuring that distant objects are not included in the rendering flow at all (frustum culling). 19 It is one of the most critical optimization steps, especially in open-world games. 15 AdaptiveLayerCulling CPU / GPU Medium Instead of cutting the overall viewing distance, it adjusts the visibility distance of specific Unity layers. 2
For example, performance is increased by restricting the rendering distance of the environmental details (grass, small decors) layer while preserving large structures around the player and erasing tiny details. 16 AdaptivePhysics CPU High Alleviates CPU load by modifying the update steps (fixedDeltaTime) or iteration counts of Unity's physics engine (PhysX or Box2D). 2 Physics calculations are among the biggest culprits of CPU-based bottlenecks. 21 AdaptiveBatching CPU Düşük Controls dynamic batching processes. Relieves the CPU in situations that do not require excessive vertex calculations. 19 AdaptiveDecals CPU / GPU Low Reduces the overdraw load during the material drawing phase by limiting the rendering distance or count of decals such as bullet holes and blood stains on walls in the URP system. 2
Developers are not obligated to stick solely to default scalers. Developing "Custom Scalers" suited to the game's specific mechanics is a highly recommended practice. 2 To write a custom scaler, inheriting from the AdaptivePerformanceScaler class and overriding the OnLevel() method alongside core properties like VisualImpact, Target, and MaxLevel is sufficient. 19 For example, in a game set in a foggy environment, writing a custom scaler can increase fog density as heat rises (Adaptive Fog). Thus, while the player's field of view naturally narrows, drawing distance in the background is shortened, creating a serious optimization illusion. 15
Performance Control Modes and Clock Frequency Management
Adaptive Performance does not merely cut graphic features within the game engine; it also has the ability to directly or indirectly interfere with the electrical power and clock frequencies supplied by the operating system to the CPU and GPU. Operating processors at maximum clock speeds creates asymptotic inefficiency; that is, a massive amount of energy is consumed and heat is generated in exchange for a small amount of extra processing power gained. 17
To manage this energy balance, the Adaptive Performance interface offers three different control modes (PerformanceControlMode): System, Manual, and Automatic. 20
System Performance Control: This is the default mode applicable on systems other than Android providers (such as desktop simulation). The operating system determines CPU/GPU frequencies itself using traditional methods; Adaptive Performance does not interfere with the hardware, it only cuts in-game graphics. 20
Manual Performance Control: The mode where the developer can directly assign
Instance.DevicePerformanceControl.CpuLevelandGpuLevelvariables between zero and the maximum level. 23 The use of this control mode is strictly not recommended outside of very specific benchmark tests. 17 If a developer without in-depth knowledge of mobile hardware thermal constraints and battery discharge characteristics keeps the CPU level high continuously, the device will rapidly overheat, the operating system will activate its defense mechanisms trapping the game in a "Throttling" phase, and the battery will be drained pointlessly. 20Automatic Performance Control: This is the safest, most efficient, and highly recommended control mode. 17 The only thing the developer needs to do is determine the game's target frame rate (e.g., 30 or 60) with
Application.targetFrameRate. 23 Automatic mode analyzes device heat, render time, and operating environment (whether in a menu or in-game) in the background. 20 If the game easily reaches the 60 FPS target, it quietly pulls CPU and GPU clock speeds down instead of running the processor at full capacity unnecessarily. The frame rate remains 60, but the hardware consumes much less electricity, ensuring the game stays cool and the battery lasts for hours (Battery Life Preservation). 20
Temporary Power Load: Boost Mode
At certain moments in mobile games, a massive processing capacity is needed instantaneously rather than sustainable performance. For such specific scenarios, Adaptive Performance houses the "Boost" API. 23 When Boost mode is called, the minimum operating frequency of the CPU or GPU is temporarily equated to the maximum operating frequency, forcing the hardware to operate at its full potential. 23
Places where Boost mode should be used strategically are 23 :
● Minimizing loading times (load time) of heavy models to be taken into memory on loading screens (Loading Screens) at the opening of the game or chapters.
● Eliminating waiting times that occur during the opening of large packages downloaded over the network (Network) or asynchronous data processing operations.
● Preventing micro-stutters (hitches) that the player might experience during shader compilation (Shader Compilation) or procedural content generation phases.
However, the activation of Boost mode draws a tremendous amount of current from the device's battery and instantly raises SoC heat. 23 If the operating system has already entered the Throttling (Bottleneck) phase (if the device is excessively hot), Unity's Boost request or Manual CPU/GPU level adjustment commands are directly rejected by the operating system to prevent hardware damage, and control is forcibly handed over to "System Mode". 23 It is vital that developers use this interface only on loading screens where the player waits passively and for one-second durations.
Developer Interface: C# API Usage and Visual Scripting
The flexibility of the Adaptive Performance package is that it allows developers to use the autonomous system without writing a single line of code if they wish, or to construct custom logic that dives deep into the heart of the game.
Event-Driven Programming via C# API
Developers who want to access the system's thermal data programmatically do so via the Singleton object UnityEngine.AdaptivePerformance.Holder.Instance (or Mobile.AdaptivePerformance.Holder in newer versions) created with the package. 18 Especially to catch that the device is about to bottleneck (ThrottlingImminent), the IThermalStatus.ThermalStatus.ThermalEvent event (delegate) is listened to. 2
When an event is triggered (for example, when a heating alarm arrives), the status is analyzed with a switch-case structure and game mechanics are interfered with. 2 If the warning level is Throttling, the frame rate is dropped from 60 to 15 or 30; if there is no warning, it returns to the 60 target again. 2 Similarly, if the bottleneck is on the CPU side, some of the active AI agents on the map can be deactivated with a custom script (script) to instantly relieve the processor. 2
Visual Scripting Integration
For non-programmer technical artists (technical artists) and game designers in Unity 5.0 and later versions, full support has been brought to the C# API through Visual Scripting packages. 29
After including the Visual Scripting package in the project, the path Edit > Project Settings > Visual Scripting > Node Library > Regenerate Units should be followed to ensure that Adaptive Performance nodes (nodes) are added to the Fuzzy Finder interface. 27
Thanks to this integration, access to a set of custom nodes is provided 30 :
● Thermal Nodes: The On Thermal Metric node is triggered instantly when the device's thermal warning level, temperature percentage (Temperature Level), and temperature trend (Trend) change. The output terminal of this node can be connected directly to the logic that will turn off a heavy light source or particle system in the scene.
● Performance Nodes: The On Bottleneck node signals whether the bottleneck is CPU, GPU, or Fillrate; while Frame Timing and FPS nodes are ideal for printing real-time performance data to the game screen. Thanks to the Cluster Info node, core loads in the big.LITTLE architecture can be read.
● Boost and Levels Nodes: By adding the Set Boost node to the beginning of scene loading blocks in the visual scripting graph, loading speeds can be maximized without writing code; with Get Performance Level, the current processor state can be read.
Testing, Profiling, and Optimization Methodology
Adding the Adaptive Performance system to the project alone does not solve all problems; a system that is not configured correctly can ruin the game's graphics quality too early or do nothing at all. The development process must rely on a scientific measurement and benchmarking methodology (profiling and benchmarking).
Establishing a Baseline and A/B Testing
According to the joint optimization practices of Google and Unity engineers, the first step to take is to measure the game's performance before ADPF or Adaptive Performance is activated (Baseline). 6 The game should be loaded onto a physical mobile device with the targeted minimum system requirements (min-spec) and played for approximately twenty minutes until the device heats up. 21 During this test, the Unity Profiler tool should communicate with the device over a wireless network (Wi-Fi) (Autoconnect Profiler) and the minutes when the FPS starts to drop and Frame Time values should be recorded. 1
Then, the Adaptive Performance system is activated in the project with default scalers, and the same test scenario is run from scratch. 6 Through the new "Adaptive Performance" tab in the Profiler module, at which minute the device gave the ThrottlingImminent warning, which scaler the system ran (such as AdaptiveResolution), and how this affected CPU/GPU times should be examined side by side with the first test. 2 If the developer reaches findings such as "The game still gives 60 FPS at the 10th minute, but the resolution drops too much", they should play with the scaler weights in the Indexer and perform game-specific fine-tuning (fine-tuning). 6
Simulation in Desktop Environment: Device Simulator
Although device tests are essential, waiting for a physical phone to heat up and cool down slows down the iteration speed during the coding phase. To overcome this situation, the Simulator (Desktop) Provider has been developed. 2 By opening the Window > General > Device Simulator window on the desktop development computer, the virtual device's battery level, thermal tendency, and bottlenecks can be triggered artificially (artificial bottlenecks). 2 The developer can transition the virtual device's state to the Throttling phase with a single click and instantly test in seconds how the custom scalers (Custom Scalers) they wrote change the fog density or model details (LOD) in the game. 2
Synergy with Traditional Optimization Approaches
Adaptive Performance is not a miracle algorithm; it cannot save a game whose foundation is incorrectly structured on its own. The system creates a massive multiplier effect when combined with classic mobile optimization practices. 1
● The game's textures (textures) should be designed in sizes of powers of two (POT - Power of Two) and mobile hardware compression formats such as ASTC and ETC2 should be used. 8
● Read/Write Enabled options of models and textures that will not be changed at runtime should be turned off to prevent keeping unnecessary copies in CPU and GPU memory. 31 Memory consumption (memory bandwidth) is one of the biggest sources of heat. 1
● If the accelerometer (accelerometer) sensor on mobile hardware is not actively used by the game (for example, if it is not a racing game), lowering or turning off the accelerometer scanning frequency via Player Settings saves the operating system a huge trouble and widens the thermal envelope (thermal envelope). 31
● Culling matrices (Occlusion Culling) of device cameras should be carefully baked (baked) and tens of thousands of polygon models that are not in the camera's field of view but remain behind walls should be culled on the CPU without being sent to the graphics processor (draw call). 3
A game whose heating time is extended to 15 minutes with all these traditional precautions, when supported by Adaptive Performance's AdaptiveResolution or AdaptiveFramerate scalers, which are the last line of defense, turns into a perfect and sustainable mobile masterpiece lasting hours where the drop from 60 FPS to 45 FPS is never noticed by the player.
The lack of cooling fans on mobile hardware forces game developers to play chess with the thermal limits of silicon. This technical journey, which starts with a simple provider setup warning like "Adaptive Performance Settings", reaches mastery of accessing the operating system's power management valves, reading thermal analysis derivatives, and manipulating quality algorithms in the render pipeline in real-time. When the optimization process focuses on the sustainability of smooth frame rate (sustained performance) rather than reaching peak performance, it both maximizes player satisfaction and unlocks long-term success on mobile platforms.
*Note: Visuals were generated by Google Gemini.